
Urban Data Challenge: what has happened since
The winners of the Urban Data Challenge were announced more than two weeks ago, on 6 April in San Francisco. What has happened to the submitted projects since then?
As word has already spread, the Urban Data Challenge was a complete success. Jointly organised by swissnex San Francisco, GAFFTA, Lift and OpenData.ch, and with the kind support of the municipal transport companies of Geneva, San Francisco and Zurich, a total of 21 projects were realised, with more than 60 people involved as designers, programmers or “data scientists”.
Among other things, the award ceremony in San Francisco was streamed live to Zurich, including a Skype conference link. Anyone who missed the award ceremony can find the complete video on youtube. On the winners, listed below, there is an in-depth article at swissnex: Winning the Urban Data Challenge.
What has happened since?
TransitVis
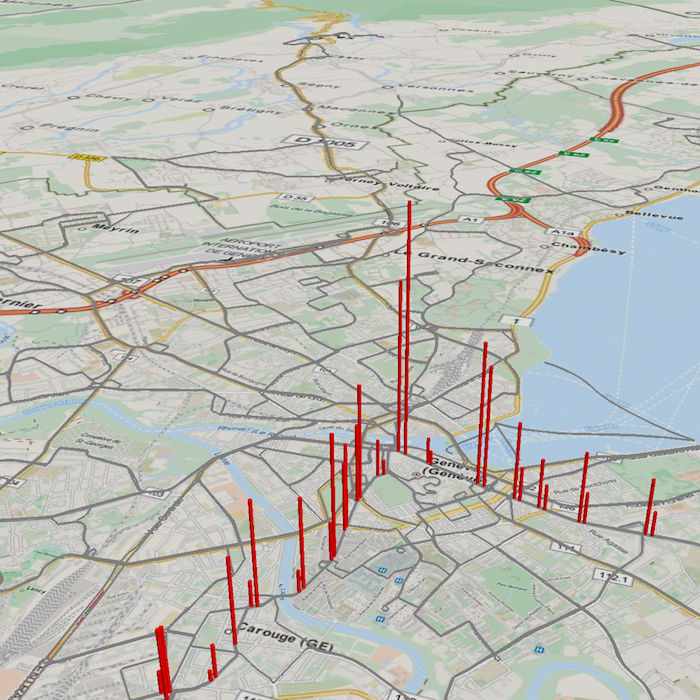
TransitVis was awarded a third place. With perfect timing, Michael Dougherty and Steve Gifford’s project was able to put its iPad app on the app store on the day of the award ceremony, where it can be downloaded free of charge ever since. The data can also be downloaded free of charge as an additional download. Unfortunately, no download figures are visible so far.
“What’s next for TransitVis, you might ask? All the interesting technology is in WhirlyGlobe-Maply so that’ll be popping up in client projects. For the app itself… we’ll wait to see if anyone uses TransitVis for anything and go from there.”
Genève transit simulator
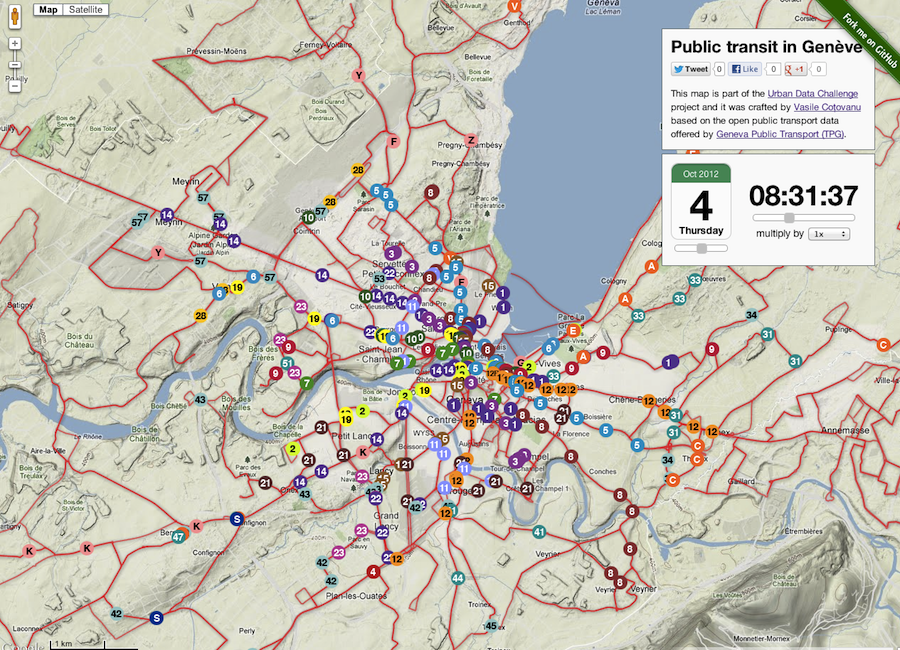
One Map, One Week in Public Transit by Vasile Cotovanu and Robert Ille received an Honorable Mention at the Urban Data Challenge. On 18 April the Google Geo Developers Blog named it Map Of The Week. The implementation of the Google Maps feature “Symbols on Polylines” was singled out for praise:
“The map uses Symbols on Polylines to display the predicted motion of the tram or bus. It uses a ‘mouseover’ event on each of the markers to open an div element displaying more information. … It’s a nice demonstration of the power of our Symbols on Polylines and the power of public data in conjunction with maps.”
Will Swiss public transport companies soon open their API?

The Urban Data Challenge has also had a positive effect on the data providers. Besides the TPG in Geneva, who already wanted to open up their API before the challenge, this step is now also to be discussed at the VBZ in Zurich. We are curious to see how things develop on this side.
Antoine Stroh of the TPG reports that their API is to be opened up by June, though it could also be July. The public presentations of the winning projects of the Urban Data Challenge are planned for later in the year, namely during OKCon 2013, which, as is well known, will take place in Geneva this year on 17 and 18 September.
The Winners
Grand Prize
Dots on the BusSecond Prizes
Transit Quality + Equity
Frustration IndexThird Prizes
A City’s Heartbeat
TransitVis
Urban Bus RacesHonorable Mentions
Breakpoints
Buzz Stop
MetroMapperSF
One Map, One Week in Public Transit
Reliable + Pleasant Transit
Transit Patterns
Urban Data Response
Further articles on the topic:
Ariel Schwartz: 3 Creative Ways To Visualize Urban Public Transportation
Fumi: Urban Data Challenge
Lift: Winning the Urban Data Challenge
Flickr: Urban Data Challenge Awards
Press:
The Frustration of San Francisco’s Mass-Transit Riders, Visualized
Un concours récompense les meilleures applications sur les transports publics
TeamUP wins third prize in Urban Data Challenge